MAE 340 EXPERIMENT 8 - MODELING OF A DC SERVOMOTOR (Part II)
CONTINUATION
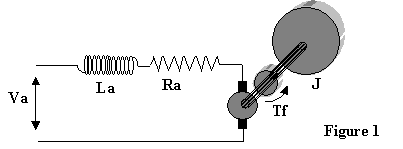
We are again dealing with a DC motor described by the electromechanical schematic below. In Part I of this experiment, the resistance Ra, the inductance La and the motor generator constant Kg were determined in a series of measurements. In this second part of Experiment 8, we continue on to the more mechanical parameters and determine the motor torque coefficient Km, the friction character as described by Tf, and the combined inertia of the motor and load J. A final test of the motor transient behavior will provide step response speed data which can be compared to a MatLab simulation.
To minimize the amount of set-up and rearranging necessary, you will be using three different workstations for this test. You will rotate through them during the course of the laboratory and obtain data at each.
EQUIPMENT AND DATA COLLECTION
The "Km Station" for determining the motor torque coefficient is in the configuration shown in Figure 2 below. The test motor is driven by a low frequency function generator signal (triangular wave-form) through the power amplifier which provides voltage to the motor armature. The motor produces a torque measured by the torque transducer and absorbed by its connection to a fixed shaft. No actual rotation takes place.
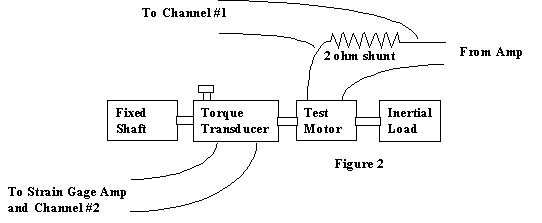
The torque transducer must be calibrated using the calibration torque arm. The arm mass is 0.10 kg and the calibration mass is 0.30 kg. Of course, the bias of the strain gage conditioner must be adjusted to show zero torque at zero current when you are gathering data.
Using the VB-Scope, capture a full low frequency cycle of the shunt resistor voltage (measuring current) and the torque transducer voltage (through the strain gage conditioner). A properly labeled and calibrated plot of torque vs current shows the motor torque character and the slope of the representative straight line is the motor torque coefficient Km in units of N.m/amp. (This is required plot #4.)
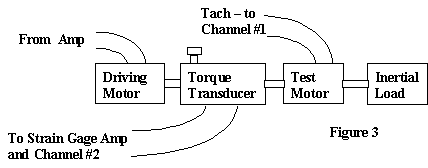
The "Friction Station" contains the motor friction apparatus shown in Figure
3. A drive motor, controlled by a low frequency voltage and power amplifier
drives the test motor through a torque transducer. The test motor tachometer is
used to measure motor speed. Capture a full cycle of the torque voltage and
tachometer voltage signals with the VB-Scope. Use the calibration scale factors
and Excel to obtain torque in N.m and speed in rad/sec. The plot of torque vs.
speed defines the typically nonlinear character of motor friction. (This is
required plot #5.) Selecting a linear representation of the motor friction
yields an equation Tf = B![]() .
Where the friction parameter B, with units of N.m/rad/sec, permits the motor to
be modeled in linear form.
.
Where the friction parameter B, with units of N.m/rad/sec, permits the motor to
be modeled in linear form.
The "Transient Station" will be used for experimentally determining the motor/load inertia and the motor/load step response. The inertia of the motor and its load can be determined with a "coast down" study. This requires running the motor at a suitable constant speed and unplugging one leg of the armature circuit. The resulting decrease in motor speed to zero is essentially linear. This results because the open electrical circuit allows the controlling deceleration effect to be the motor friction torque. The friction torque may be assumed to be a constant value and you should be able to estimate its value from your plot #5 above.
The arrangement of Figure 4 is used to obtain the coast down graph. Supply a few volts to the motor armature to obtain a constant speed – perhaps at a tachometer voltage level of 3-4 volts. Unplug the armature supply and record the transient tach voltage as it coasts to zero speed. Use Excel to insert the tach calibration and plot
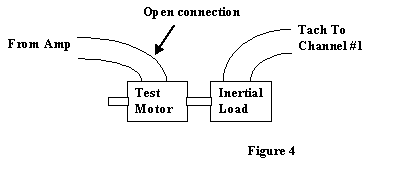
speed (in rad/sec) vs. time during coast down. (This is required plot
#6.) The slope, i.e. the deceleration, of the linear coast down curve with the
typically constant brush friction allows the calculation of J = Tf / ![]() as the total inertia of the
motor and load.
as the total inertia of the
motor and load.
The final piece of data to close this experiment uses the motor and its inertial load connected simply as shown in Figure 5 below.
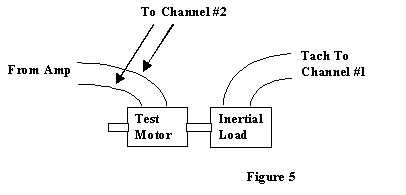
In this configuration, supply a square wave from the power amplifier adjusted "with offset" to oscillate between zero and about 2 volts. Monitor the square wave on channel 2 of the VB-Scope to be sure that it is nicely square. If it is not, you may need to reduce the function generator amplitude a bit since the amplifier maximum current capability is only a bit over one amp and, if overloaded, the square wave will be affected. When your square wave is properly adjusted, you should find the motor speed fluctuating between zero and about 200 rpm. Be sure that you capture a clean "up-going" motor transient on the VB-Scope. Scale the result and adjust the time scale appropriately with Excel to show the motor step response from "zero time" with speed in rad/sec. (This is required plot #7.) You will also want to prepare the Excel file in a text form ready for MatLab to read.
QUESTIONS
REPORT
A single report is to be submitted for the complete Experiment 8. The report should be submitted in FULL report form. Each individual must submit his/her own report in which written text should be prepared independent of your group partners. But you are welcome to work with your partners on data processing, graphs, the determination of system parameters and on the MatLab simulations of the motor/load step response.