Frequently in studying the behavior of dynamic systems it is necessary to compare laboratory data with dynamic simulation results. LabView?s direct communication with Excel makes that conveniently possible. After cleaning up your data, scaling it, etc., saving the critical columns to a text file in MS-Dos form allows MatLab to read it easily. Since Dr. Mook has begun to provide you with a MatLab background, you should be ready to produce a dynamic simulation and compare it to system data from the laboratory. The results of the simulation can be compared to the lab data by plotting the simulation results (typically as a curve) and the lab results (typically as data points) on the same axes. Listed below is a file produced from Excel and consisting of time and dynamically changing variables. The file name is "firstexamp.txt".
0 0 0
1 0.283468689 0.362538494
2 0.486582881 0.659359908
3 0.632120559 0.902376728
4 0.736402862 1.101342072
5 0.811124397 1.264241118
6 0.864664717 1.397611576
7 0.903028032 1.506806072
8 0.930516549 1.596206964
9 0.950212932 1.669402224
10 0.964326007 1.729329434
11 0.974438467 1.778393683
12 0.981684361 1.818564093
13 0.986876271 1.851452844
14 0.990596437 1.878379875
15 0.993262053 1.900425863
16 0.99517205 1.918475592
17 0.996540623 1.93325346
18 0.997521248 1.945352555
19 0.998223896 1.955258456
20 0.998727366 1.963368722
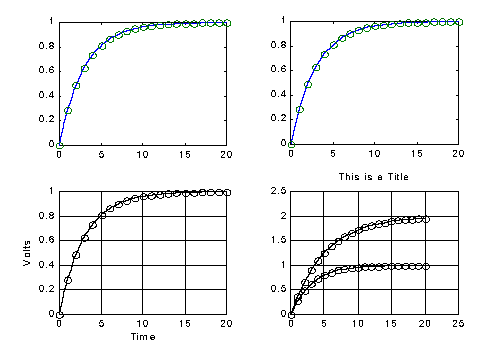
The file below is a listing of a MatLab ".m" file. It first loads the Excel text file and places it in the vector "tdata" and matrix "xdata". It also creates a simple dynamic system model "SysC" which will hopefully match the data. The solution with the MatLab function "step" is then obtained and plotted in the upper left of a 4 plot page. The "lsim" solution is plotted in the upper right. Following this, the two simulations are re-plotted in the lower left and lower right with labeling and scaling also performed. In the last plot both state variables are plotted.
%LOADING THE EXCEL DATA
load firstexamp.txt
tdata = firstexamp(:,1)
x1data = firstexamp(:,2)
x2data = firstexamp(:,3)
%CREATING A SYSTEM MODEL
A=[-1/3 0; 0 -1/5];
B=[1/3; 2/5];
C=[1 0];
D=[0];
SysC=ss(A,B,C,D);
%SOLVING BY "step" AND PLOTTING
[ysim,tsim,xsim]=step(SysC,20);
subplot(221);plot(tsim,ysim,tdata,x1data,'o')
%SOLVING BY "lsim" AND PLOTTING
Tcalc=0:1:20;
Ustep=ones(21,1);
[ysim2,tsim2,xsim2]=lsim(SysC,Ustep,Tcalc);
subplot(222);plot(tsim2,ysim2,tdata,x1data,'o')
%REPLOTTING THE "step" RESULT WITH AXIS LABELS
%AND BLACK CURVE/DATA POINTS
subplot(223);plot(tsim,ysim,'k',tdata,x1data,'ko')
xlabel('Time');
ylabel('Volts');
grid
%REPLOTTING THE "lsim" RESULT
%RECOVERING THE STATE VARIABLES
%APPLYING SCALING, TITLE AND BLACK CURVE/DATA POINTS
x1=xsim2(:,1);
x2=xsim2(:,2);
subplot(224);plot(tsim2,x1,'k',tdata,x1data,'ko',tsim2,x2,'k',tdata,x2data,'ko')
axis([0. 25. 0. 2.5]);
title('This is a Title');
grid