Introduction
This experiment considers the rotational damper as a representative component
of rotational mechanical systems. This damper has been carefully designed to
have linear behavior. Of course, you are to decide whether the design has been
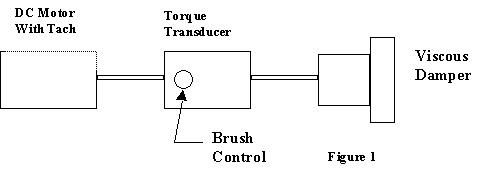
successful or not for the damper in your lab station. The mechanical
configuration of the test arrangement is shown in Figure 1 below.
Equipment Set-up and Preparation
The "spring study" that you performed in the previous experiment used
"student actuation" to produce spring motion and obtain force - deflection data.
Here we will use a DC motor to provide more controlled actuation. The motor is
driven by a function generator through a power amplifier. The amplifier is shown
schematically in Figure 2 connected to the armature-input terminals of the DC
motor. The motor contains a built-in tachometer, which we will use to measure
rotational speed. However, the tach output voltage is inherently too high for
the input of the National Instruments analog to digital converters and must be
reduced to a +/- 5 volt range for the speed range desired. The potentiometer
shown in Figure 2 provides this reduction in scale. 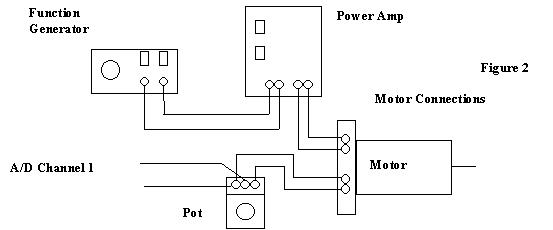
The torque transducer
shown in Figure 1 is used to obtain a voltage signal proportional to torque. The
transducer uses strain gages to measure torque. The strain gages rotate with the
rotating shaft and the resulting signal is taken from the rotating shaft by
brushes/commutators. The brushes are located under the brush control knob. They
create friction that can affect torque measurements. Make sure that you have the
torque transducer positioned as shown in Figure 1 so that the brush friction
torque does not interfere with the measurement of damper torque.
Calibration
1. With the tachometer output connected to the potentiometer as shown in Figure 2 and the function generator and power amplifier controlling the motor, set the function generator to a low frequency (not too much more than 0.10 Hz) and a square waveform. Adjust the function generator offset and amplitude to have the speed oscillating as high as you can, but not more than +/- 750 rpm. With the square wave signal operating, measure the tachometer output voltage (try the DMM - the digital multimeter) at about 12 volts, and also note the channel #1 voltage. Adjust the potentiometer so that the resulting A/D signal on channel #1 is in the range of about +/- 3 volts. Calibrate the speed measurements by noting that the tachometer gain is 16.5 volts/1000 rpm. The resulting ratio together with the tachometer gain defines your channel #1 calibration. Obtain this calibration scale factor in units of radians/sec/volt.
2. Disconnect the motor from the power amplifier. Calibrate the torque
transducer by using the deadweights and torque-arm available in the lab. Measure
the length of the arm to the center of your weight. Include the arm weight
itself and recall that torque (N-m) = mass (kg) X 9.81 N/kg X length (m). Zero
the conditioner and apply the torque-arm load to the transducer, supporting the
shaft on the other side of the transducer as necessary to hold the load. The
calibration scale factor is "applied load over change in voltage". Calculate the
calibration scale factor in units of Newton-meters/volt.
Studying the Motor-Damper System
Place the function generator in the triangle wave mode at low frequency and connect it to the power amplifier and motor. Obtain again about +/- 750 rpm variation in motor speed using the VirtualBench-Scope to monitor the waveform on channel #1. Also plot the voltage from the function generator on channel #2. Capture a few oscillations of both waves on the time plot. Use Excel to scale the plot appropriately (this is required plot #1).
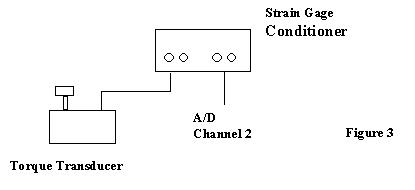
Remove the function generator signal from channel #2 and replace it with the
torque voltage from the strain gage conditioner as in Figure 3. Obtain a time
plot of the speed signal and torque signal and scale both appropriately with
Excel (this is required plot #2). Take the same data and construct a
torque-speed curve on properly scaled axes to show the characteristic behavior
of the damper (this is required plot #3).
Specific Questions
1. In an ideal world, the curves in your plot #1 should look very much alike. The speed plot would be fully linear and show the same triangular shape as the function generator voltage. Explain why the actual speed plot is not more triangular. Does your speed plot show "flat regions" as it passes through zero? Explain why this occurs and may have been expected.
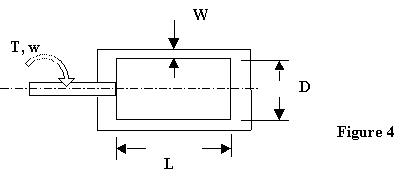
2. Are your damper characteristics essentially linear? If not, discuss factors which may have produced nonlinear characteristics. Obtain the effective linear damping coefficient in units of N-m/rad/sec.
3. Figure 4 below shows a schematic description of an idealized linear damper. It is filled with hydraulic oil and produces frictional effects only between the inner and outer radial surfaces. Derive an algebraic expression for the damping coefficient in terms of the fluid viscosity and geometry of the damper. The gap W is small enough to have laminar flow.