There are many plotting functions that perform different functions in Matlab. Here is a list of some that may be particularly helpful in your work:
6.2 Miscellaneous Graphics Commands
|
Function |
Performs |
|
clf |
Clears the graphics window |
|
contour |
Allows you to generate a contour plot of a three dimensional object |
|
hold |
Holds the current plot so you can add to it |
|
subplot |
Allows you to put many in the same window |
|
figure |
Allows you to create multiple graphics windows |
|
gco |
GCO Get handle to current object |
|
close |
Allows you to close graphics windows |
|
plotyy |
Creates 2d plot with different y axes on 2 sides |
|
loglog |
Creates a log-log plot |
|
semilogy/semilogx |
Create semi-log plots with one coordinate on a log scale. |
|
gtext |
Plce text in a plot with the mouse |
|
ginput |
Get data using the mouse from a graph |
>> help gtext

 GTEXT  Place text on a graph using a mouse.
        GTEXT('string') displays the graph window, puts up
        a cross-hair, and waits for a mouse button or
        keyboard key to be pressed.  The cross-hair can be
        positioned with the mouse (or with the arrow keys on
        some computers).  Pressing a mouse button
        or any key writes the text string onto the graph at
        the selected location.  See also: GINPUT
This function can simplify the process of placing text in the
graphics window to specify notes about the plot. The other function
is called ginput. Help used on this second function shows:
>>  help ginput

GINPUT  Graphical input from a mouse or cross-hair.
        [X,Y] = GINPUT(N) gets N points from the graph
        window and returns the X- and Y-coordinates in
        length N vectors X and Y.  The cross-hair can be
        positioned using a mouse (or by using the Arrow
        Keys on a terminal).  Data points are entered by
        pressing a mouse button or any key on the keyboard.
        [X,Y] = GINPUT gathers an unlimited number of
        points until the return key is pressed.
        [X,Y,BUTTON] = GINPUT(N) returns a third argument
        BUTTON that contains a vector of integers specifying
        which mouse button was used (1,2,3... from left) or
        ASCII numbers if a key on the keyboard was used.
        [X,Y] = GINPUT(N,'sc') returns X and Y in screen-
        coordinates where (0.0,0.0) is the lower-left corner
        of the screen and (1.0,1.0) is the upper-right
        corner.  Otherwise, data-coordinates are returned.
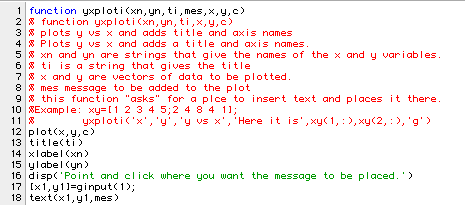
There are a number of uses for this function. Here is a simple modification, using ginput of the yxplot function:

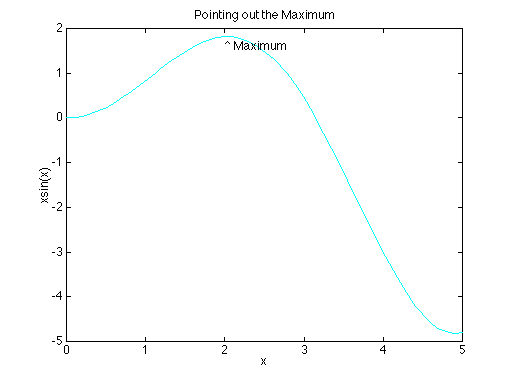
Now if you execute yxploti you can add whatever message you want at the point that you designate on the screen. Here is a sample run and its plot:
>> xs=0:.1:5;

>> ys=xs.*sin(xs);

>> yxploti('x','xsin(x)','Pointing out the Maximum','^ Maximum',xs,ys,'c')
